- info@dsoninfotech.com
- Mon - Sat 10:00 AM - 6:30 PM
Infographic Design Services

Infographic Design
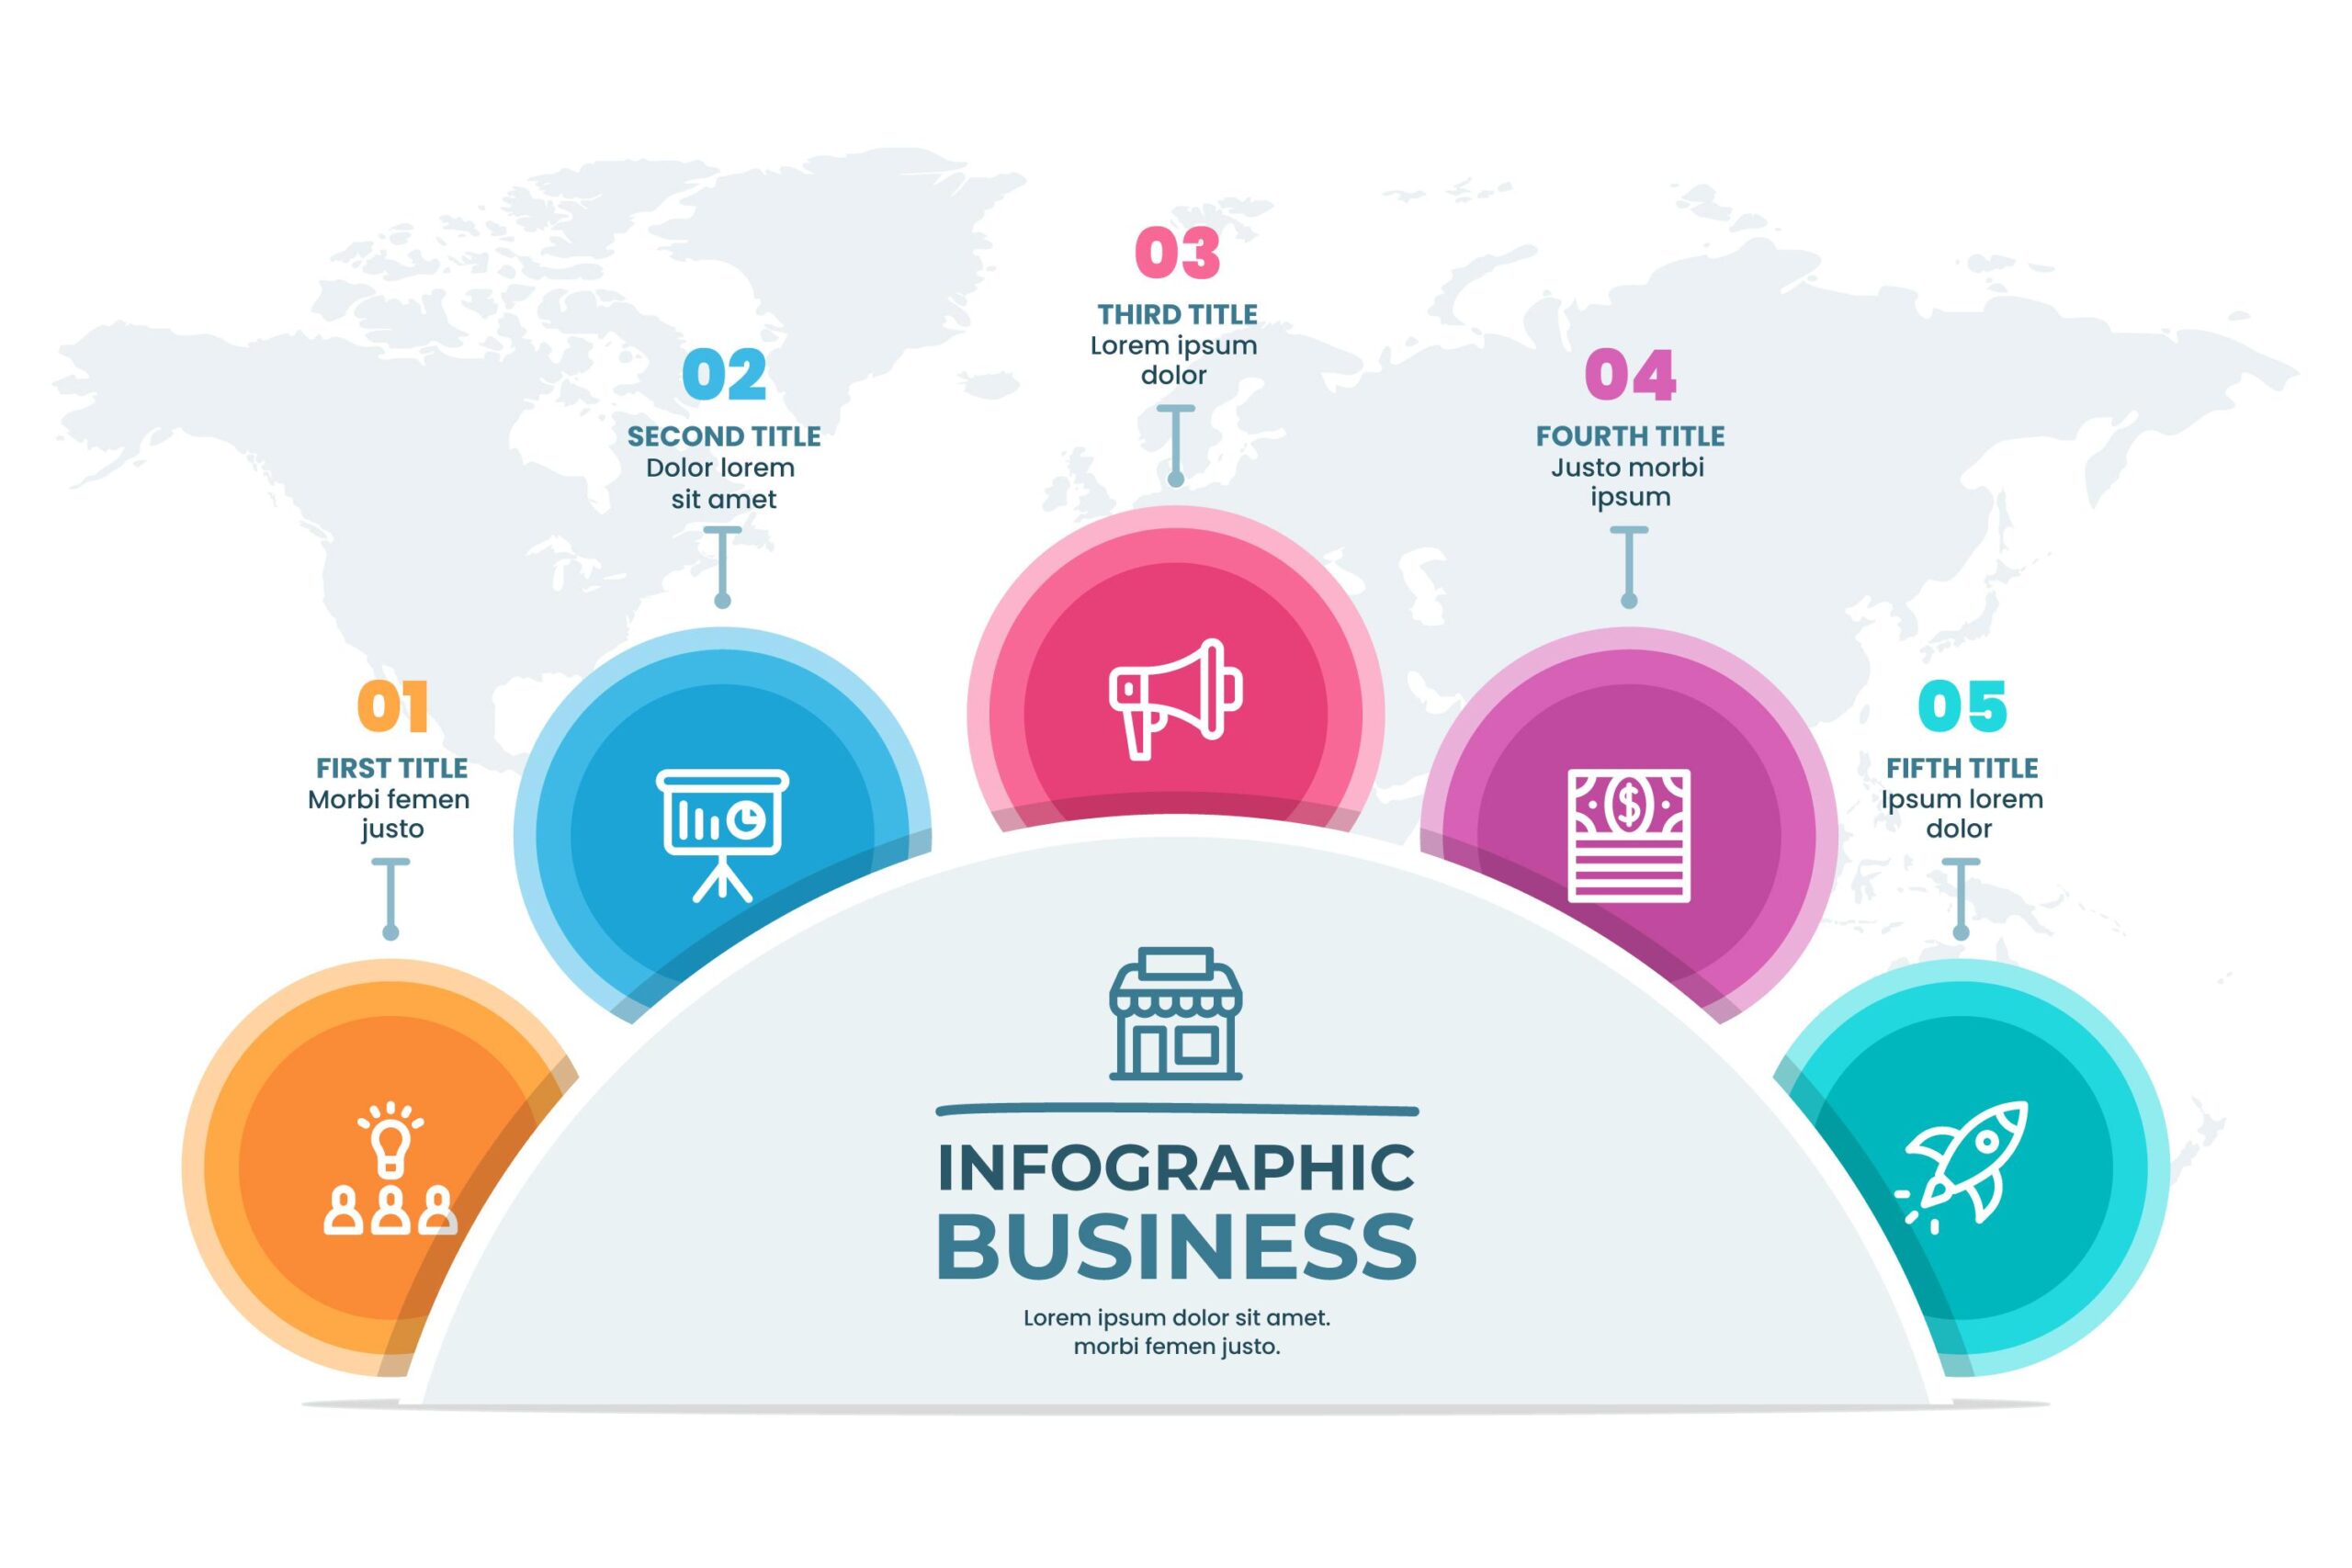
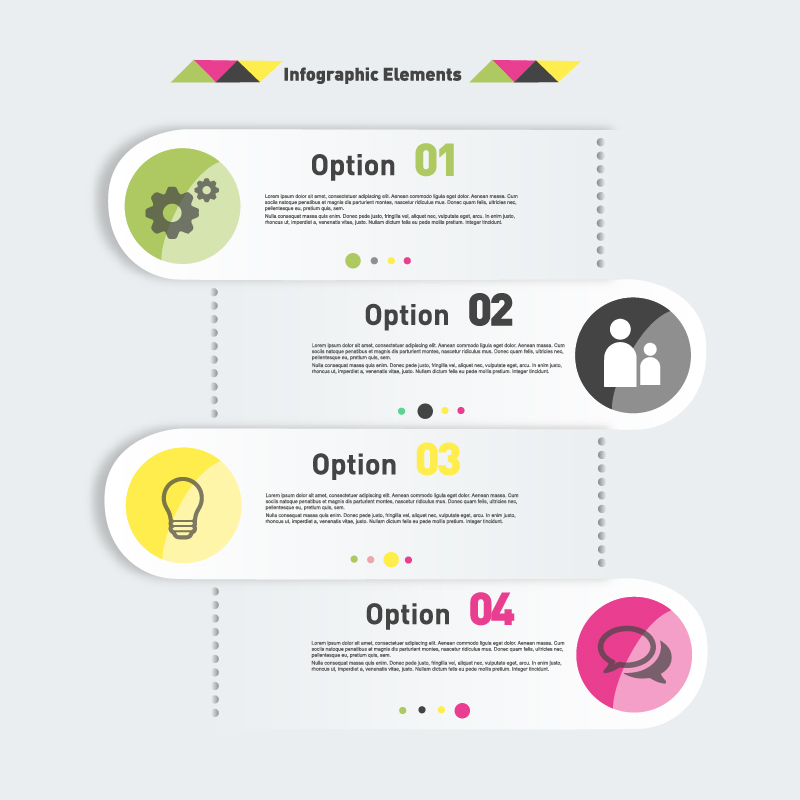
Infographic design is a visual representation of information, data, or knowledge presented in a clear and concise format. It combines graphics, images, and text to convey complex information in an easily understandable and visually appealing manner. The goal of infographic design is to simplify and communicate information quickly, making it accessible to a broad audience. Infographics often use elements such as charts, graphs, icons, and illustrations to enhance the presentation of data. They are commonly used in various fields, including marketing, education, journalism, and business, to convey statistics, processes, timelines, or any information that benefits from a visual representation. Infographic design leverages the power of visuals to engage and inform viewers effectively.
Types of Infographic Design
Statistical
Ideal for presenting numerical data, trends, and comparisons. Effective for making data-driven arguments and illustrating key statistics.
Informational
Versatile for conveying detailed information on a specific topic. Great for educational purposes, explaining concepts, or providing in-depth insights.
Timeline
Useful for showcasing chronological events, project milestones, historical developments, or any sequence of activities over time.
Process
Valuable for breaking down complex processes into manageable steps. Useful for procedural explanations, guides, or instructional content.
Comparison
Essential for contrasting and comparing different elements, products, or options. Clear visuals help viewers understand differences at a glance.
List-Based
Highly readable and suitable for presenting information in a structured list format. Useful for summarizing key points or features.
Flowchart
Helpful for illustrating decision-making processes, workflows, or organizational structures. Ensures a clear understanding of interconnected steps.
Data Visualization
Powerful for transforming complex data sets into visually appealing representations, aiding in better understanding and interpretation.
Geographic
Effective for displaying location-based information, demographic trends, or regional statistics. Useful in marketing, social sciences, and demographics.
Interactive
Engage audiences with interactive elements, allowing users to explore additional layers of information. Useful for digital platforms and online presentations.
Comparison Matrix
Valuable for comprehensive comparisons of multiple variables or criteria. Ideal for decision-making scenarios or product evaluations.
Animated
Animated infographics can bring data to life, making them memorable and captivating for the audience.
The Effectiveness of Infographic Design
Unlock the potential of your message with the effectiveness of infographic design. Distilling complex information into visually engaging graphics, infographics captivate and inform. These dynamic visual tools streamline communication, making data more digestible and memorable for your audience. With a strategic blend of color, imagery, and concise text, infographics offer a compelling narrative that resonates. Enhance understanding, increase engagement, and leave a lasting impact on your viewers.
Elevate your communication strategy by harnessing the power of infographic design to convey your information with clarity and visual appeal.

How Does It Work?
Plan and Gather Information
Define your infographic's purpose and identify your target audience. Gather relevant and accurate information that you want to communicate.
Design Structure and Visual Elements
Choose a layout that best fits your content (linear, radial, or grid-based). Create a visual hierarchy using contrasting colors, fonts, and sizes. Select suitable visual elements like icons or charts.
Create and Refine
Develop the infographic, focusing on clarity and readability. Ensure a cohesive color scheme, consistent design elements, and a logical flow of information. Edit and revise for clarity and impact.
Finalize and Share
Actively engage with your audience by responding to comments, messages, and mentions. Foster a sense of community around your brand.
Benefits of Infographics Design
Improved Information Retention
Visual content is processed faster by the brain, leading to better retention of information. Infographics effectively convey complex data in a memorable and easily understandable format.
Enhanced Engagement
Infographics are visually appealing, capturing attention and encouraging audience engagement. Viewers are more likely to interact with and share visually compelling content, extending its reach.
Simplified Complex Information
Infographics break down intricate or dense information into digestible, bite-sized chunks. This simplification aids in conveying complex concepts, statistics, or processes with clarity.
Increased Accessibility
Visual content is accessible to a broader audience, including those who may find text-heavy information challenging. Infographics accommodate different learning styles and cater to diverse audiences.
Effective Communication of Data
Infographics are particularly effective in presenting data, statistics, and trends. Visual elements like charts and graphs make numerical information more accessible and comprehensible.
Brand Recognition
Well-designed infographics contribute to brand recognition. Consistent use of brand colors, fonts, and styles helps reinforce the visual identity, making the content easily associated with the brand.
Versatility Across Platforms
Infographics can be easily shared across various platforms, including social media, websites, presentations, and print materials. Their versatility makes them suitable for diverse communication channels.
Increased Social Media Sharing
Visual content, including infographics, is more likely to be shared on social media platforms. This sharing can amplify your message, increase brand visibility, and attract a wider audience.
Supports Storytelling
Infographics can be used to tell a story visually. By organizing information in a narrative format, they engage the audience and create a more compelling and memorable experience.
Facilitates Decision-Making
Clear and concise infographics assist viewers in making informed decisions. Whether comparing products, understanding processes, or analyzing data, infographics provide a quick overview for decision-making.
0+
Infographics Made by Us
Designing infographics that make information memorable, using eye-catching graphics and concise text to convey key messages with impact.
Why Choose Us?
Tailored Visual Communication
We specialize in crafting infographics that align with your unique message and brand identity. Our tailored designs ensure your content stands out and resonates with your audience.
Strategic Design Expertise
With a strategic approach to color, layout, and content, our team brings a wealth of design expertise to create infographics that not only look visually appealing but also effectively convey your information.
Collaborative Process
Choose us for an inclusive and collaborative design process. Your input is valued at every stage, ensuring the final infographic reflects your vision and meets your communication goals.
Clarity in Communication
Our infographics prioritize clarity. We distill complex information into easily digestible visuals, making your message not only visually appealing but also highly comprehensible for your audience.
Effective Visual Narratives
Elevate your message with our commitment to creating effective visual narratives. Our infographics tell a compelling story, ensuring your information is not only seen but also remembered by your audience.
Experience the Extraordinary
Choose us for infographics that go beyond the ordinary. We believe in creating extraordinary designs that captivate viewers, leaving a lasting impression and ensuring your content stands out in the crowd.
Know What Say Our Clients About Us
Reviews
My website is on top position in Google, its effect reflects in my business; I am entirely satisfied with the services
KUNAL PANCHAL
Neptune Industries
I can see enhancement in my business after connecting with D’son Infotech; my website, social media pages, blogs are well maintained
MAHENDRA PATEL
Rudrra SensorFAQs
What is the typical turnaround time for an infographic design project?
Turnaround times vary based on project complexity. On average, expect 2 to 4 weeks from concept to final approval.
How much input do I have in the design process?
We value your input. Your preferences, feedback, and brand guidelines are integral to creating a design that aligns with your vision.
Do you provide multiple design concepts for me to choose from?
Yes, we typically present several initial design concepts. This allows you to choose the direction that best aligns with your brand and objectives.
Can you handle both the design and printing of the infographic?
While our expertise lies in design, we can recommend reliable printing services or collaborate with your preferred vendors for a seamless process.
What information do you need from me to start the design process?
We require details about your brand, target audience, and specific content you want to include. Sharing brand guidelines and preferred aesthetics is helpful.
How do you ensure the infographic aligns with our brand identity?
We conduct thorough research into your brand, ensuring a deep understanding of its identity, values, and target audience. This guides our design choices.
Can you create infographics for various platforms and sizes?
Absolutely. We design infographics to be versatile, ensuring they are effective and visually appealing across different platforms and sizes.
What file formats will be provided upon completion?
We typically provide the final designs in industry-standard formats, such as high-resolution JPEGs or PNGs, suitable for various applications
How many revisions are included in the design process?
We offer a set number of revision rounds to refine the design based on your feedback. Clear communication ensures the final product meets your expectations.
Can you design infographics for specific industries or topics?
Yes, we are experienced in designing infographics for various industries and topics. We adapt our designs to suit the unique needs and preferences of each client.

